- Brokerage
- Retirement & pension
- Tax-free savings
- Education savings
- Joint
- US & Canadian account types
Years of history. A few uploads.
- Drop in a CSV or Excel export (the most exact), a PDF statement or a screenshot as far back as you have them.
- Only have today’s holdings? A screenshot works. Nimblewit works out your cost and asks roughly when you bought.
- Check every row before anything is saved.
- Stay current by forwarding your broker’s trade emails and approving each one, or add a trade by hand.
PDF or screenshot
Wherever you are as an investor.
Just opened your first investment account?
See what you own and how it's doing in plain language — free while your portfolio is small.
Growing your income?
Every account in one place, every dividend tracked, and a calendar of what's coming next.
Thinking 10 or 20 years out?
Free calculators plus a retirement income planner in the Tools tab to project your portfolio, income and retirement, plus custom benchmarks and a delayed price refresh. Household accounts are on the way.
Everything you'd check in a spreadsheet — without the spreadsheet.
Know what you've been paid — and what's next.
Every payment received, plus a 12-month calendar of what's coming, declared or estimated.
DRIP, set for you
Each holding gets the right reinvestment — cash, fractional or whole shares — automatically. Change it anytime.
Market & sector allocation
See what you really own across every account — by market, sector and asset class.
Returns over any period
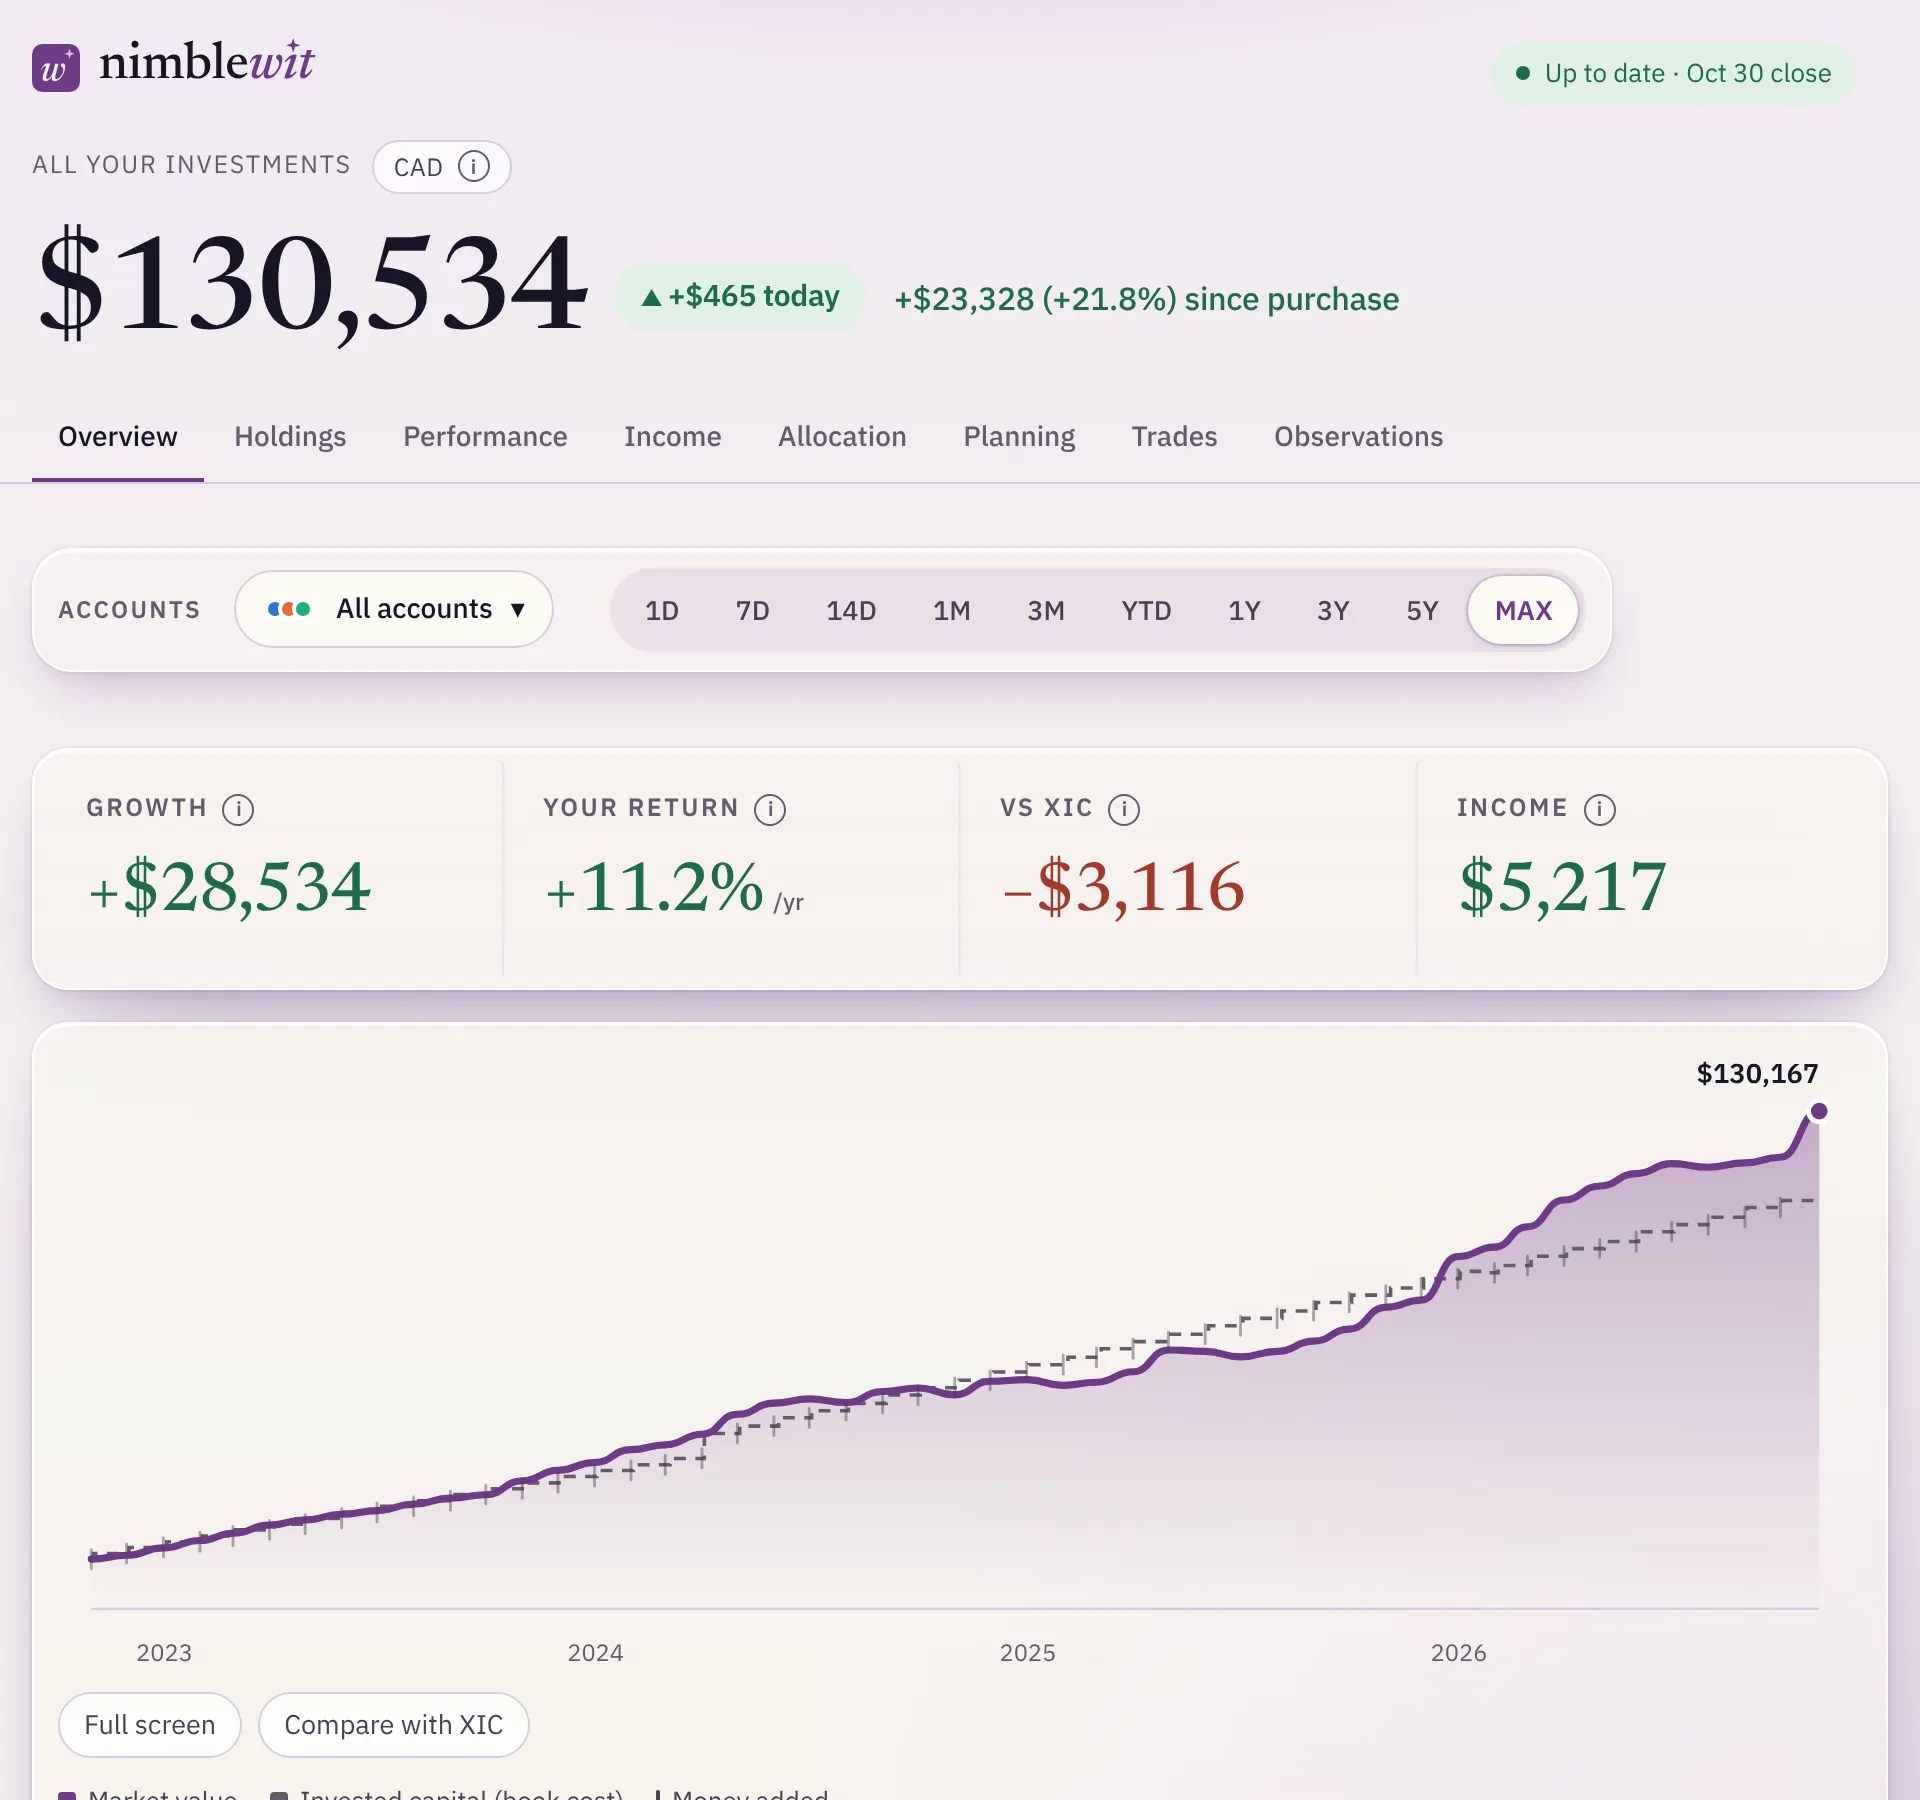
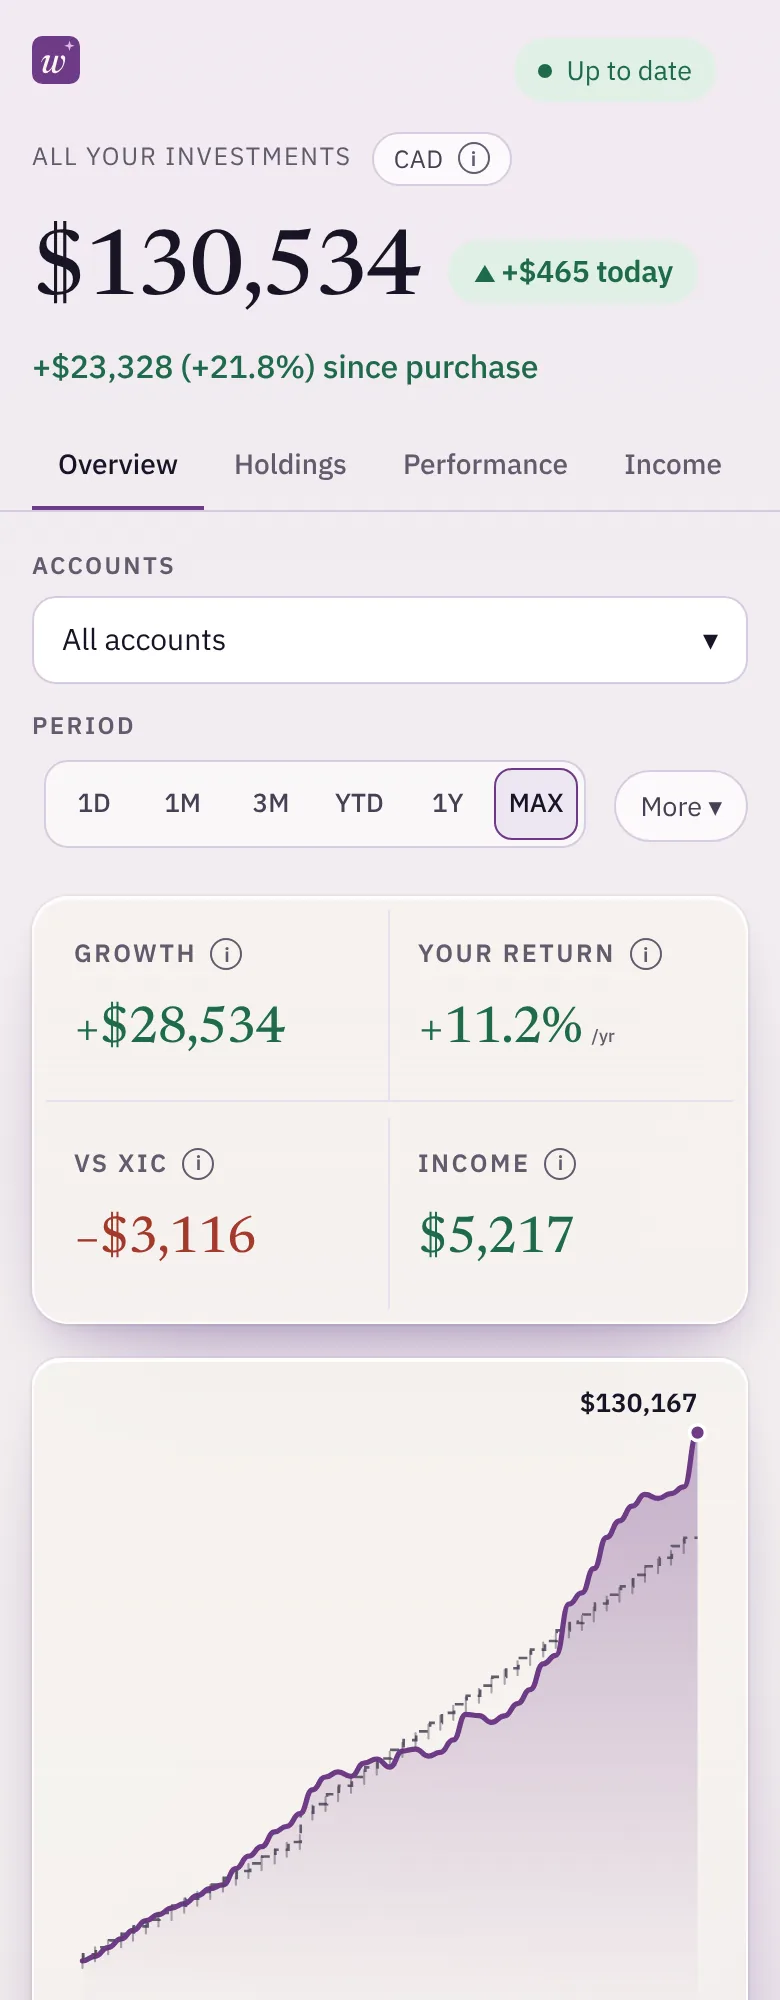
Your return, money-weighted so cash you add never looks like growth, with a chart of where the growth came from: money added, price growth and distributions. Today, 7 or 14 days, a month, a year or all time, with what moved your portfolio. Starter covers today and 1 month or longer; 7- and 14-day views start on Builder.
Group your accounts
Save groups of accounts by institution or goal and switch views in one tap — retirement, kids, dividend strategy.
Observations
Plain-language notes drawn from your own holdings: how much sits in Canada, where you are concentrated, funds that overlap, and what your fund fees cost in dollars a year. Measurements, not advice.
Cash & currencies
Cash per account in a couple of clicks; US and Canadian holdings converted for you.
Emails you control
A monthly summary, plus income and upcoming-dividend emails on Builder and up. Each has its own switch in Settings.
Plan your retirement income
Set your ages, savings and withdrawal rate and see the income your portfolio could support, with your dividends counted inside it. A simulated range shows good and bad market years, and a chance the money lasts. Compare saved plans and export one as a PDF. It's an illustration, not advice.
Benchmarks
Compare with the S&P 500 and TSX. Planner lets you add your own comparison stocks.
Why investors switch to
| Feature | Typical tracker | Nimblewit |
|---|---|---|
| Load full history from CSV, PDF statements or screenshots | CSV or manual | |
| New trades from your broker’s emails, no bank login | Bank login or manual | |
| Upcoming dividend income, estimated | Limited | |
| DRIP assigned automatically | Manual | |
| Market and sector allocation | Paid tiers |
Keep an eye on your investments for the price of a coffee.
Every new account gets Builder free for 30 days. No card needed.
- 10 holdings · 2 accounts
- Full-history import · 5 PDF or screenshot reads a month (CSV and Excel files in a recognised layout are not limited)
- Unlimited manual trades
- Returns for today and 1 month or longer, market allocation & dividends received
- Automatic DRIP
- Paper accounts to test ideas
- Peek at your next month of expected dividends
- 50 holdings · 5 accounts
- Full 12-month expected income calendar
- 7- and 14-day views, built on daily prices
- Monthly income and upcoming-dividend emails
- 10 PDF & screenshot reads a month
- Email your trades: forward broker fill emails, approve in a tap (10 a month)
- Everything in Builder
- Unlimited holdings & accounts
- Retirement income planner (Tools tab): project your portfolio and retirement income, with a simulated range of outcomes, saved plans and PDF export
- Custom benchmarks: add your own stocks
- Delayed price refresh: update prices on demand, about 15 minutes behind the market
- Unlimited PDF & screenshot reads and trade emails
- Household accounts and shared access (coming)
Prices are plus applicable taxes. Paid plans are available in the United States and Canada. The free plan works everywhere.
Questions, answered.
Does it work where I live?
Yes, if you hold stocks or ETFs listed in the United States or Canada. Holdings on other exchanges aren't supported yet. Plans are billed in Canadian dollars, and your card provider converts the charge.
Which markets and currencies are supported?
Stocks and ETFs listed on US and Canadian exchanges, with US-dollar holdings converted automatically. More markets are on the roadmap.
What does the free plan include?
Starter is free with no time limit: 2 accounts, 10 holdings, unlimited manual trades, 5 PDF or screenshot reads a month, paper accounts, your returns for today and for 1 month or longer, allocation, dividends received and the next month of expected dividends. Builder adds the full 12-month income calendar, 7- and 14-day views, the income emails and trade emails (forward your broker’s order-filled emails and approve each trade). Planner adds the retirement income planner in the Tools tab, custom benchmarks and a refresh button for prices delayed about 15 minutes.
What happens when my 30-day trial ends?
You move to the free Starter plan unless you choose a paid plan. Nothing is deleted. If you're over the free limits, you pick which accounts stay on your dashboard (the oldest stay if you don't choose). The rest are kept with their history and come back when you upgrade.
What counts as a holding, and what are the limits?
A holding is one security, however many accounts it sits in, so the same ETF in two accounts counts once. Starter allows 10 holdings and 2 accounts, Builder 50 and 5, and Planner has no limits.
What can I import, and how many statements can I read?
CSV and Excel exports from your broker, PDF statements and screenshots (including a screenshot of just your current holdings), or a Nimblewit export file. You review every row before anything is saved. PDF and screenshot reads are limited each month (5 on Starter, 10 on Builder, unlimited on Planner), and only reads that succeed count. Manual trades and spreadsheet imports in a recognized layout are not limited. On Builder and Planner you can also forward your broker’s order-filled emails from any broker to your private Nimblewit address, 10 a month on Builder and unlimited on Planner.
What does the retirement income planner do?
The Tools tab holds free calculators (FIRE, and dividends with reinvestment) on every plan, prefilled from your real portfolio. On Planner it also has a retirement income planner: you enter your ages, savings, other income and a withdrawal rate, and it projects your portfolio and your yearly retirement income, with your dividends counted inside the withdrawal. It also runs 1,000 simulated market paths to show a range of outcomes and the chance your money lasts to a chosen age. You can save named plans and export one as a PDF. It's an illustration, not advice or a forecast, and it doesn't calculate tax.
Can I cancel any time?
Yes. Cancel in Plan & billing and you keep your plan until the period you paid for ends, then move to Starter. Nothing is deleted.
Where is my data stored?
Your portfolio data is stored in Canada. Some service providers we rely on, such as our web host and the service that reads uploaded statements, may process requests outside Canada. Our privacy policy lists each one.
Can I export or delete everything?
Yes. You can export all of your data at any time, and delete all of it from Settings. Deleting is permanent.
Is this investment or tax advice?
No. Nimblewit calculates figures from the data you give it and from third-party prices, so check important numbers against your broker statements. Expected income and projections are estimates, and nothing here is investment, tax or legal advice.
See your whole portfolio tonight.
Free to start · Builder free for 30 days · No card needed
Get started — it's free